Climate Change and Biodiversity

Biodiversity and climate change are linked throughout the Earth’s history with each moving in concert with the other. The number and distribution of species adapts to compensate for changing climatic conditions and in turn, biodiversity plays a role in mitigating climate.
Rapid climate change, such as that attributed to anthropogenic emissions of greenhouse gases is generally associated with biodiversity loss. This presents a serious challenge for the Wheatbelt NRM region which; while recognised as being a major biodiversity hotspot, is also one of the most extensively cleared regions of the planet with a high extinction rate. How we manage our biodiversity into the future relies on our understanding of how it may respond to projected climate scenarios.

Species Distribution Models

Species Distribution Modelling can provide an estimate of the impacts of climate change on species distributions in the Wheatbelt NRM region.  A full description of the methods used to derive the layers can found in the Southern and South-Western Flatlands data layers: Data layers explained report.

Analyses were based on CMIP3 climate change models which have been superseded by the CMIP5 models. Although based on different assumptions, the projections of change in precipitation and temperature between the suites of models have been found to be similar. Go here for a summary of how the models compare.

The data presented in the maps are based on the three climate scenarios and two timeframes:

  • B1 = low emission scenario
  • A1B = medium emission scenario
  • A2 = high emission scenario
  • 2030 = 2030 timeframe
  • 2080 = 2080 timeframe

Change in biodiversity can be represented in many different ways. The maps presented here show the potential of climate change to influence the following aspects of biodiversity:

  • Species Richness – High richness areas represent where the greatest number of potential habitats coincide;
  • Biodiversity Refugia  – areas where species retreat to  (species with a common responses to climate);
  • Species Turnover – presents a percentage value that represents the extent of difference between the suite of species present under current and future climate scenarios.
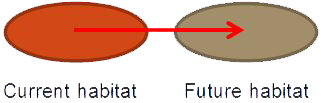
  • Species Movement Vectors – a simplified means of displaying the direction of habitat change of a species by using an arrow where the start point is the middle of the current distribution and the end is the middle of the future distribution. Note there is no consideration of how an individual species will move through the landscape.
  • Vegetation Community composition
    • Response group – maps of change represent the number of groups with at least half their species remaining
    • NVIS modelling –
      • negative value = decrease in the probability of community occurrence;
      • positive value = increase in the probability of community occurrence; and
      • zero value = no change.

Iconic threatened fauna


Biodiversity and Climate Change:  Western Mouse (Pseudomys occidentalis)

By 2080 there will be no suitable climate habitat in the Avon River Basin for the Western Mouse under medium emissions scenarios.


Biodiversity and Climate Change: Honey Possum (Tarsipes rostratus)

The area of suitable climate habitat for the honey possum is greatly reduced to the western fringe of the Avon Arc and the south-east corner of the region into the future under medium climate emissions. 


Biodiversity and Climate Change: Carnaby’s Black Cockatoo (Calyptorhynchus latirostris)

By the year 2080, the area of suitable climate habitat for Carnaby’s Black Cockatoo moves south in the Avon Arc and disappears from the Great Western Woodlands under medium climate emissions.


Biodiversity and Climate Change: Western Spiny-Tailed Skink (Egernia stokesii badia)

In contrast to many other threatened fauna in the region, the area of suitable climate habitat in 2080 for Western Spiny-Tailed Skink increases dramatically in the Avon River Basin under medium emissions scenarios. The species tends to occur in conditions more arid than our current climate.


Biodiversity and Climate Change: Red-tailed Phascogle (Phascogale calura)

By 2080, the current distribution of red-tailed phascogale across the southern third of the region would have contracted to only a tiny portion of suitable climate habitat along the southern fringe of the Avon Arc under medium emission scenarios.


Biodiversity and Climate Change: Black-Flanked Rock Wallaby (Petrogale lateralis)

Suitable climate habitat for the black-flanked rock wallaby will almost completely disappear from the Avon River Basin by 2080 under medium emission scenarios. 


Biodiversity and Climate Change: Western Ring-Tailed Possum (Pseudocheirus occidentalis)

The current area of suitable climate for the ring-tailed possum in the Avon River Basin is limited to a small area on the fringe of the Avon Arc. By 2080 this area may no longer exist under medium emissions scenarios.


BACK TO TOP

Climate change and flora in the Wheatbelt NRM region

Climate Change and flora species richness

The western fringe of the Avon Arc and southern fringes of the Great Western Woodlands and Southern sub-regions are important refugia for flora in the region and potentially areas of high species richness into the future.

Click here to open this map full screen

BACK TO TOP

Climate change and flora species movement

In general flora species will tend to move into the region from a north-westerly location; and out of the region in south-westerly or south-easterly direction.

Click here to open this map full screen

BACK TO TOP

Climate change and flora species turnover

The Central, Eastern and Great Western Woodlands sub-regions show the greatest potential for high species turnover; by the year 2080 under high emission scenarios the majority of these areas will have a turnover rate of >70%.

Click here to open this map full screen

BACK TO TOP

Climate change and fauna in the Wheatbelt NRM region

Areas of high refugia scores for fauna are generally scattered across the northern half of the region; by 2080 under high emissions, important refuges remain as small scattered areas in the Avon Arc and Great Western Woodlands.

Click here to open this map full screen

BACK TO TOP

Climate change and birds

Patterns in projected bird refugia are strongly influenced by the location of wetlands and heavily wooded areas of the Great Western Woodlands.

Click here to open this map full screen

BACK TO TOP

Climate change and fish

Areas of fish refugia are limited to very small areas on the western fringe of the Avon Arc. In the short-term, high emissions may favour the distribution of fish in the region, however, the opposite is true in the long-term when there may be no suitable climate habitat for fish.

Click here to open this map full screen

BACK TO TOP

Climate change and mammals

In the short-term, low and medium emissions may increase the area suitable for mammals through the cleared areas of the Central and Eastern sub-regions and the south-eastern fringe. The worst scenario may be produced by medium emissions to 2080 where less than 50% of species will potentially find refuge across the region.

Click here to open this map full screen

BACK TO TOP

Climate change and reptiles

Reptile refuge is greatest in the Avon Arc and northern Central sub-regions in the short-term and in the long-term under low emissions. Higher emissions may drastically reduce areas of good climate suitability to small scattered portions across the region.

Click here to open this map full screen

BACK TO TOP

Stay Connected

Subscribe to our updates

Keep up to date on current events, funding opportunities and NRM in the Wheatbelt.

Left Column
Right Column